
Profile Perfect Level 429 Answer
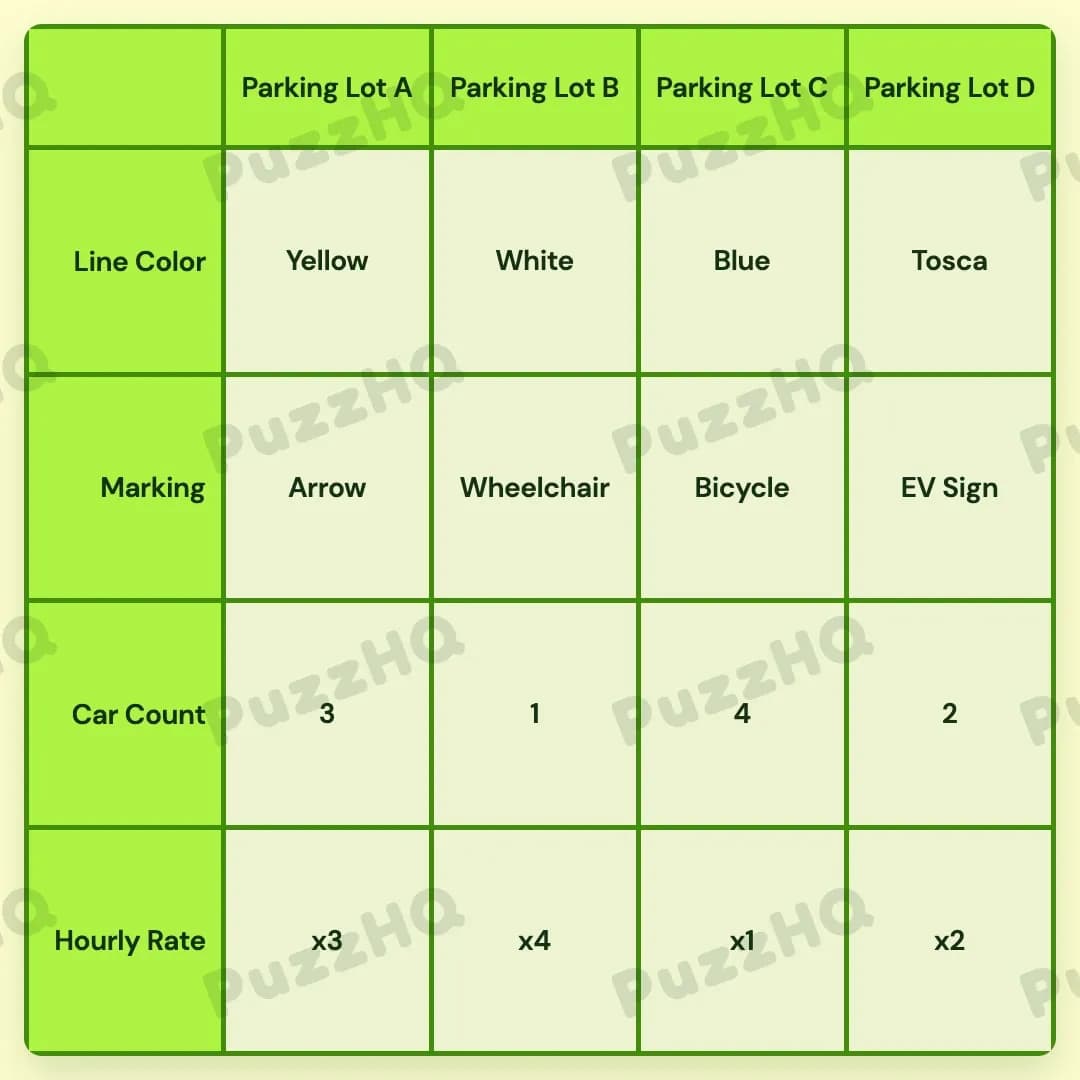
Every parking space is fully resolved by cross-referencing vehicle volumes, line colors, special markings, and hourly pricing tiers across the four lots.
| Trait | Parking Lot A | Parking Lot B | Parking Lot C | Parking Lot D |
|---|---|---|---|---|
| Line Color | Yellow | White | Blue | Tosca |
| Marking | Arrow | Wheelchair | Bicycle | EV Sign |
| Car Count | 3 | 1 | 4 | 2 |
| Hourly Rate | x3 | x4 | x1 | x2 |
Building The Grid By Trait
Finding an entry point in this puzzle begins with physical layout and visual features. Line Color provides immediate spatial anchors that bridge directly into the pricing system, which in turn unlocks the volume of parked vehicles and specialized markings.
Line Color And Positional Anchors Set The Stage
The layout runs from left to right across four distinct spaces, labeled Parking Lot A through Parking Lot D. The most direct physical clue states that Yellow lines appear on the leftmost lot. This immediately fixes Yellow in Parking Lot A without needing any secondary deduction.
From here, Line Color connects closely to the pricing structure. We learn that Tosca lines mark the second cheapest parking lot, while Blue lines are designated for bicycle parking. This means neither Tosca nor Blue can occupy Parking Lot A. Furthermore, because Tosca is directly tied to the second cheapest rate (x2), establishing where the rates fall will instantly lock down Tosca's physical column.
With Yellow locked at the far left, the remaining colors (White, Blue, and Tosca) must distribute among Lots B, C, and D based on how rates and markings unfold.
Hourly Rate And Car Count Establish The Core Dynamics
The economic logic of the parking facility dictates how many drivers choose each space. We are told that the cheapest lot attracts the highest number of vehicles. Since the rates span from x1 to x4 and the vehicle counts span from 1 to 4, the x1 hourly rate must pair directly with the maximum car count of 4.
Next, we evaluate the placement of the second busiest parking lot, which holds 3 cars. The clues state that this 3-car lot cannot sit adjacent to the cheapest lot (the one with the lowest fare of x1). If the x1 rate were placed in the middle or next to the 3-car lot, adjacent conflicts would arise. Placing the x1 rate and its 4 cars at Parking Lot C satisfies all spacing requirements, forcing the 3-car lot to the far left at Parking Lot A.
Once Parking Lot A is identified as holding 3 cars, the clue regarding the opposite end takes effect. The lot at the far opposite end from the 3-car lot is Parking Lot D, which receives the x2 rate. Since Tosca lines represent the second cheapest rate, Parking Lot D is confirmed to have both the x2 rate and Tosca lines.
With x1 assigned to Lot C and x2 assigned to Lot D, the remaining rates are x3 and x4. The clue noting that the lot next to the White lines carries a specific pricing link resolves Lot B as having White lines and the highest rate of x4, leaving Lot A with the x3 rate. Consequently, Blue lines fall into Parking Lot C alongside the x1 rate.
The car counts now slot into place rapidly. Lot C holds 4 cars (cheapest lot) and Lot A holds 3 cars. The remaining counts to distribute are 1 and 2 between Lots B and D.
Marking Completes The Trait Map
The final trait row integrates specialized symbols painted on the ground. We know from earlier clues that a Bicycle marking corresponds to the lot with Blue lines, placing the Bicycle directly into Parking Lot C.
For the remaining markings (Arrow, Wheelchair, and EV Sign), behavioral and numerical restrictions guide the placement:
- The clue stating that hardly anyone uses the lot with disability access means the Wheelchair marking must belong to the lot with the absolute lowest volume (1 car).
- The clue specifying that the lot with the Arrow marking does not have 2 cars prevents the Arrow from landing on whichever lot holds 2 cars.
Because Parking Lot A holds 3 cars, it easily takes the Arrow marking. This leaves the 1-car count and the Wheelchair marking for Parking Lot B. Parking Lot D receives the remaining car count of 2 and takes the final symbol, the EV Sign.
Where The Trait Rows Intersect
Car Volume Reflecting Price Sensitivity
The connection between the Hourly Rate row and the Car Count row acts as the central engine for solving the middle columns. Instead of treating car tallies as arbitrary figures, the clue that links the lowest rate (x1) to the highest traffic (4 cars) immediately collapses two independent trait rows into paired units. This pairing drastically reduces the search space for Parking Lot C and allows adjacent positioning rules to work smoothly.
Line Color Directing Rate Allocations
Line Color does not operate in isolation; it functions as a visual label for specific price brackets. Associating Tosca lines directly with the second cheapest tier (x2) means that whenever spatial clues resolve the position of the x2 rate, the Tosca line color follows automatically. Similarly, locking Blue lines to the Bicycle marking allows the color row to settle the moment the Bicycle symbol finds its home at Parking Lot C.
Specialized Markings Constraining Occupancy Numbers
The interaction between Markings and Car Count provides the finishing deductions. The Wheelchair symbol is explicitly defined by low utilization, demanding a count of 1. When combined with the negative rule that the Arrow marking cannot equal 2 cars, the markings row decisively splits the remaining quantities between Parking Lot A, Parking Lot B, and Parking Lot D.
Final Grid Check
Every row in the completed grid harmonizes across all constraints. Parking Lot A stands on the leftmost edge with Yellow lines, an Arrow marking, 3 cars, and an x3 rate. Parking Lot B features White lines, a Wheelchair symbol, the lowest car count of 1, and the x4 rate. Parking Lot C combines Blue lines, a Bicycle icon, the cheapest x1 rate, and the maximum traffic of 4 cars. Parking Lot D rounds out the opposite end with Tosca lines, an EV Sign, 2 cars, and an x2 rate. Every clue requirement is fully satisfied.
Comments