
Profile Perfect Level 14 Answer
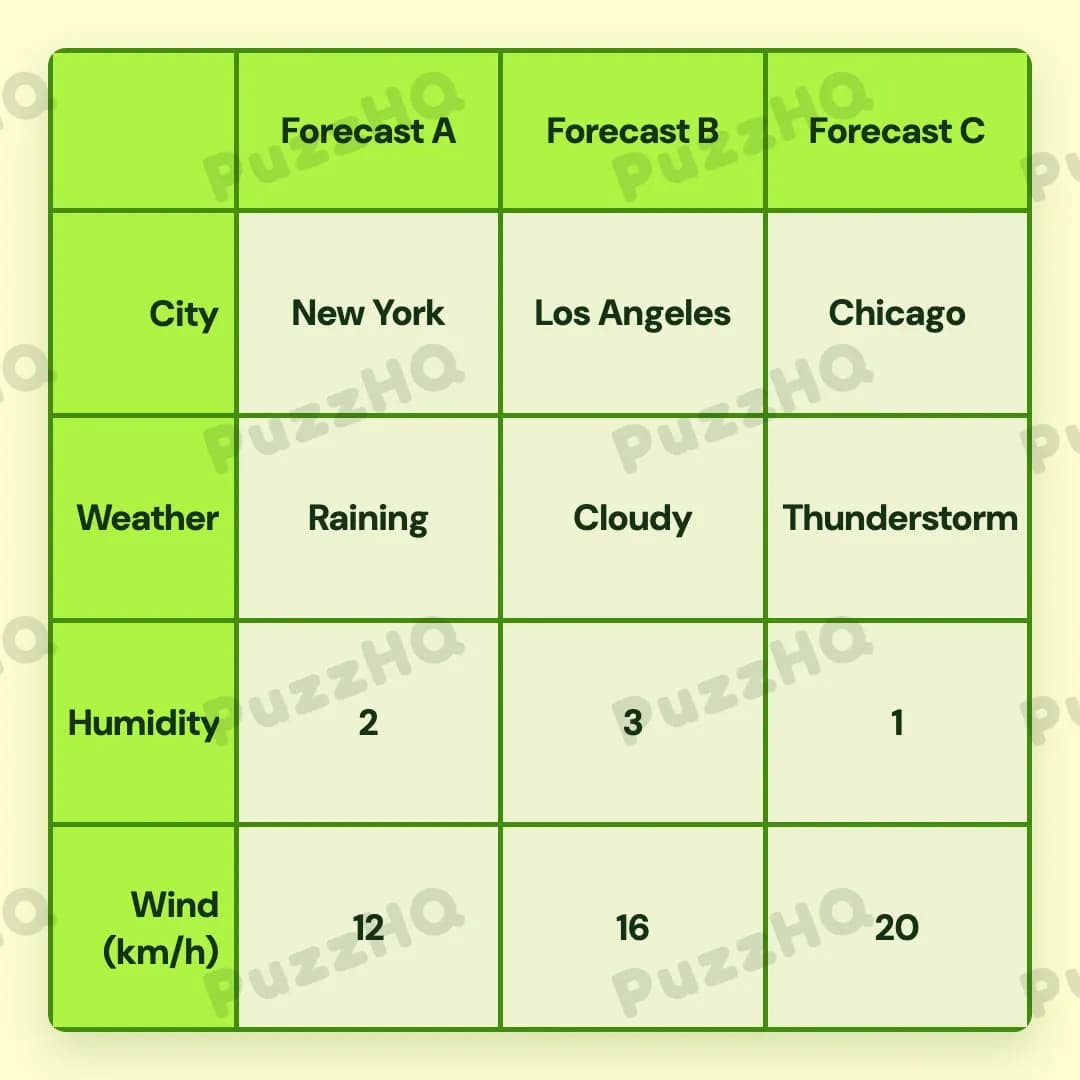
Here is the complete forecast breakdown across all three reporting columns.
| Trait | Forecast A | Forecast B | Forecast C |
|---|---|---|---|
| City | New York | Los Angeles | Chicago |
| Weather | Raining | Cloudy | Thunderstorm |
| Humidity | 2 | 3 | 1 |
| Wind (km/h) | 12 | 16 | 20 |
Building The Grid By Trait
Solving this puzzle efficiently means starting with the direct geographical and atmospheric anchors, where explicit assignments instantly narrow down the possible locations for the remaining traits.
City And Weather Establish The Core Layout
The City and Weather trait rows resolve almost simultaneously because several clues tie specific forecast columns directly to names and conditions.
To begin, we learn directly that the forecast in the middle is for Los Angeles. This anchors Los Angeles squarely in Forecast B. At the same time, another clue mentions that it is raining in Forecast A. This fixes the raining weather condition in the first column.
Next, we look at the paired condition stating that Chicago is predicted to have a thunderstorm. Because Chicago and thunderstorm belong to the very same subject, they must occupy an open column that has neither an assigned city nor an assigned weather condition. Forecast B already has Los Angeles, and Forecast A already has the raining condition. Therefore, Chicago and its thunderstorm cannot fit into Forecast A or Forecast B. They must both belong to Forecast C.
With Chicago assigned to Forecast C and Los Angeles assigned to Forecast B, only one city remains open: New York. New York naturally fills the city row for Forecast A. Similarly, with raining in Forecast A and thunderstorm in Forecast C, the only remaining weather condition is cloudy, which slots cleanly into Forecast B. In just a few logical steps, both the City row and the Weather row are completely solved.
Wind Speeds Anchor To Geographic Locations
The available wind speed values in this puzzle are 12 km/h, 16 km/h, and 20 km/h. The wind trait row resolves by combining positional speed clues with the city identities we established in the previous step.
One clue states that the strongest wind is blowing for Forecast C. Among the three potential wind speeds, 20 km/h represents the highest value. This immediately assigns 20 km/h to Forecast C.
Another clue notes that New York has the slowest wind today. Because our earlier deductions placed New York in Forecast A, we know that Forecast A must hold the lowest wind speed. The lowest available value is 12 km/h, so 12 km/h is assigned to Forecast A.
With 20 km/h assigned to Forecast C and 12 km/h assigned to Forecast A, only the middle wind speed remains. We assign 16 km/h to Forecast B, completing the entire Wind (km/h) row.
Humidity Levels Fall Into Place From Weather Conditions
The humidity trait contains values of 1, 2, and 3, which represent a scale from lowest to highest. This row resolves through direct atmospheric relationships outlined in the clues.
A direct clue tells us that the thunderstorm city has the least humidity. We already know from our weather analysis that the thunderstorm is occurring in Forecast C. Since the least humidity corresponds to a value of 1, Forecast C is assigned a humidity rating of 1.
Another clue states that the city with cloudy weather is the most humid. Our weather breakdown placed the cloudy condition in Forecast B. The highest possible humidity value on the scale is 3, which means Forecast B receives a humidity rating of 3.
With two of the three columns set, only one humidity value and one column remain open. Forecast A is currently missing its humidity rating, and the median value of 2 has not yet been placed. Placing 2 into Forecast A completes the Humidity row across all subjects.
Where The Trait Rows Intersect
Looking at how specific clues bridge multiple trait rows clarifies why the puzzle solves so smoothly when categories are analyzed in tandem.
Linking Chicago And Thunderstorm To Lock The Forecast Columns
The clue linking Chicago directly to a thunderstorm serves as the primary turning point for the grid. Because Forecast A had an established weather condition and Forecast B had an established city, the combined package of city plus weather could only fit into the single untouched column, Forecast C. This single clue simultaneously resolved the remaining question marks for two full rows at once.
Connecting Wind Extremes Directly To City Identity
The wind category relies heavily on cross row deduction rather than standalone wind clues. While one wind extreme is stated as a column position, the other is tied to a specific city name. Knowing beforehand that New York belonged to Forecast A allowed the slowest wind clue to instantly convert into a column assignment for Forecast A. Without resolving the city row first, the wind speed clues would have remained unanchored.
Humidity Scales Dictated By Atmospheric Conditions
The humidity row depends entirely on the resolved weather conditions. Neither of the humidity clues gives a column letter directly. Instead, they refer exclusively to atmospheric conditions like cloudy skies and thunderstorms. By using the Weather row as a bridge, we were able to translate condition descriptions into exact column placements for humidity values 1 and 3 without any ambiguity.
Final Grid Check
Every row in the completed grid harmonizes with every other trait. Forecast A accurately reflects New York experiencing rain with the slowest wind at 12 km/h and moderate humidity. Forecast B correctly represents Los Angeles with cloudy skies, a moderate wind speed of 16 km/h, and the peak humidity rating of 3. Forecast C holds Chicago with its thunderstorm, carrying the lowest humidity rating of 1 alongside the strongest winds at 20 km/h. All clues are completely fulfilled without contradiction.
Comments